Flagship research · MLB analytics · 2026
Window-Adjusted WAR (wWAR)
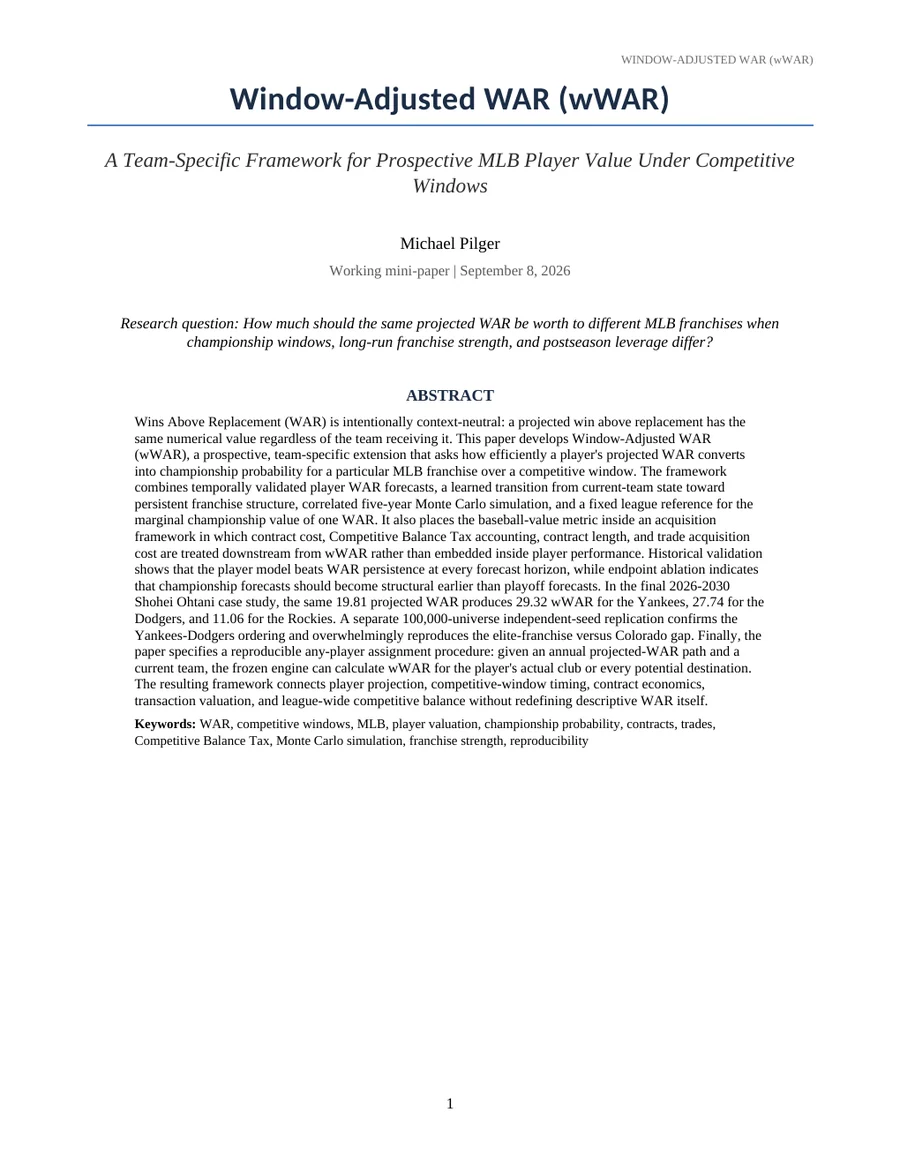
A team-specific framework for prospective MLB player value under competitive windows. Standard WAR estimates player production; wWAR estimates how that projected production translates into championship value for a particular franchise.
Research question: How much should the same projected WAR be worth to different MLB franchises when championship windows, long-run franchise strength, and postseason leverage differ?
wWAR Explorer
Compare one player across MLB destinations, or switch to Front Office to ask the inverse question: given one club and position need, which candidate creates the most marginal value?
Reading the model in plain English
Contract and fair-value context will appear after the player data load.
The model separates baseball value from economic fit so the richest team is not automatically treated as the ideal destination.
Peak = 85–100 · Open = 65–84 · Emerging/Closing split the 40–64 band by five-year direction · Closed = below 40.
wWAR by franchise spending rank
Each point is a destination. X-axis rank is frozen franchise spending capacity: 1 is the lowest historical spender and 30 is the highest.
Baseball Value: raw WAR never changes when the destination changes. Window Score now blends 70% current competitive state, 15% 2026–2030 championship leverage, and 15% franchise spending capacity. Current state uses 2026 win percentage, run differential, and postseason qualification, so a low-payroll club playing at a championship level can still have an open window. Window Contribution remains player-specific wWAR versus that player’s median destination.
Economic Fit — Experimental: the primary screen is now marginal rather than affordability-weighted. Phase 22 estimates transaction-date mWAR after roster displacement, translates that championship value into dollars, and subtracts the same remaining salary burden for every destination. Franchise spending capacity remains descriptive context rather than a salary discount. CBT effects, prospect/acquisition cost, negotiation, guarantee structure and direct finalist simulation remain downstream considerations.
Destination-specific results under a fixed player projection
The final case study holds Shohei Ohtani's 2026–2030 projection constant at 19.81 WAR and varies only the destination environment.
Ohtani wWAR by destination
Frozen 50,000-universe production model. The vertical marker denotes 19.81 projected raw WAR.
Model architecture
The framework separates player performance, team context, league simulation, and downstream transaction economics.
Player WAR forecast
Project expected MLB WAR one through five seasons ahead using temporally validated player models.
Team-strength forecast
Blend current competitive state with persistent franchise structure using learned horizon-specific decay.
Joint MLB simulation
Simulate correlated five-year regular-season and postseason outcomes under the 12-team playoff format.
Paired counterfactual
Compare baseline and player-added universes using common random numbers to isolate the player's marginal effect.
wWAR normalization
Convert marginal championships through a fixed, player-independent league reference; compute pWAR separately.
Transaction economics
Apply salary, CBT effects, contract control, roster displacement, and acquisition cost downstream from wWAR.
Out-of-sample and simulation checks
Validation is temporal where possible and compares the framework with simpler baselines before applying it to the final case study.
| Test | Result | Interpretation |
|---|---|---|
| Player forecast vs. WAR persistence | MAE improvement at H1–H5: 0.204, 0.272, 0.326, 0.361, 0.384 WAR | Forecast layer improves on persistence at every horizon. |
| Hybrid team strength, H1 | 9.33-win MAE vs. 9.52 CurrentState, 10.15 Structural | Current-state information improves the near-term forecast. |
| H1 playoff probability | Brier 0.2065; 13.4% skill vs. naive; AUC 0.725 | Probability estimates improve on the equal-probability benchmark. |
| Fixed WS reference stability | Forward mean 10.7% above 2021–2025 historical mean | The normalization reference remains reasonably stable. |
| Independent NYY–LAD replication | +1.86 wWAR; 95% interval +0.67 to +3.04 | The 100,000-universe replication preserved the ordering. |
Production estimates
Values below are taken from the frozen 50,000-universe production run reported in the paper.
| Team | Raw WAR | wWAR | 95% MC CI | Multiplier | Δ expected titles | Δ P(≥1 WS) | pWAR |
|---|
Full methodology and results
The 22-page paper documents the hypotheses, data design, player forecasting, team-strength architecture, postseason simulation, fixed-reference normalization, validation, Ohtani case study, transaction economics, reproducibility, applications, and limitations.
The framework is prospective and model-based. Contract, trade, and prospect costs are not treated as baseball performance; they enter as separate downstream decision variables.